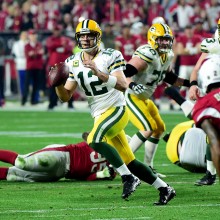
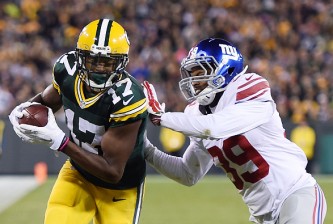
This from NBC Sports. On Monday, the overnight ratings showed that the World Series beat Sunday Night Football 10.5-10.3. But when the final ratings were said and done, Sunday Night Football on NBC beat World Series Game 4 on Fox with a 9.8 rating and a 15 share. The Green Bay Packers at Minnesota Vikings blowout drew 16.9 million viewers.
World Series Game 4 garnered a 9.4/15 and 16.0 million viewers. Since 2010, the World Series has beaten SNF on NBC only once and that was a New Orleans 62-7 blowout of Indianapolis and drew one of the worst ratings in the series’ history.
Milwaukee was tops among all local markets with a 48.2/65 and that was followed by Minneapolis-St. Paul with a 41.8/59.
Here’s the NBC press release.
NBC’S SUNDAY NIGHT FOOTBALL TOPS WORLD SERIES FOR THIRD TIME IN FOUR YEARS
Vikings-Packers Blowout Draws 16.9 Million Viewers Against World Series Game 4
NBC Posts Best 8-Week Start for NFL Primetime Package in 17 YearsSTAMFORD, Conn. – October 29, 2013 – The Green Bay Packers’ 13-point victory against the Minnesota Vikings on NBC’s Sunday Night Football averaged 16.9 million viewers – marking the third time in four years that SNF topped World Series Game 4 (16.0 million viewers for Red Sox-Cardinals on Fox).
NBC’s Sunday Night Football – primetime television’s #1 show – is averaging 22.1 million viewers, marking the best eight-week start for an NFL primetime package in 17 years (23.9 million in 1996 for Monday Night Football) and up 4% from last year (21.2 million average).
In addition, SNF tops primetime TV in season-to-date live plus same day household rating (13.1 – best in 14 years for NFL primetime package after eight weeks).
Sunday’s game, in which Green Bay QB Aaron Rodgers completed 24 of 29 pass attempts for 285 yards and two touchdowns in the Packers’ 44-31 victory, drew a 9.8 rating/15 share (8:31-11:06 p.m. ET).
Following is the history of NBC’s Sunday Night Football against World Series Game 4:
Date SNF Rating/Viewers World Series Rating/Viewers 10/27/13 GB (44), Min (31) 9.8 HH/16.9 million Bos (4), St. L (2) 9.4 HH/ 16.0 million 10/28/12 Den (34), NO (14) 10.7 HH/17.7 mill. SF (4), Det (3) 8.9 HH/15.5 million 10/23/11 NO (62), Indy (7) 7.6 HH/12.5 million Tex (4), St. L (0) 9.2 HH/15.2 million 10/31/10 NO (20), Pitt (10) 10.7 HH/18.1 mill. SF (4), Tex (0) 9.0 HH/15.5 million TOP METERED MARKETS FOR PACKERS-VIKINGS:
1. Milwaukee 48.2/65 2. Minneapolis 41.8/59 3. New Orleans 16.7/23 4. Indianapolis 14.8/23 5. Richmond 13.4/19 6. Seattle 13.3/23 7. Denver 13.2/22 8. Sacramento 13.1/21 9. Las Vegas 13.1/20 10. Chicago 13.0/20
That is all.

